TUI
Errors tab
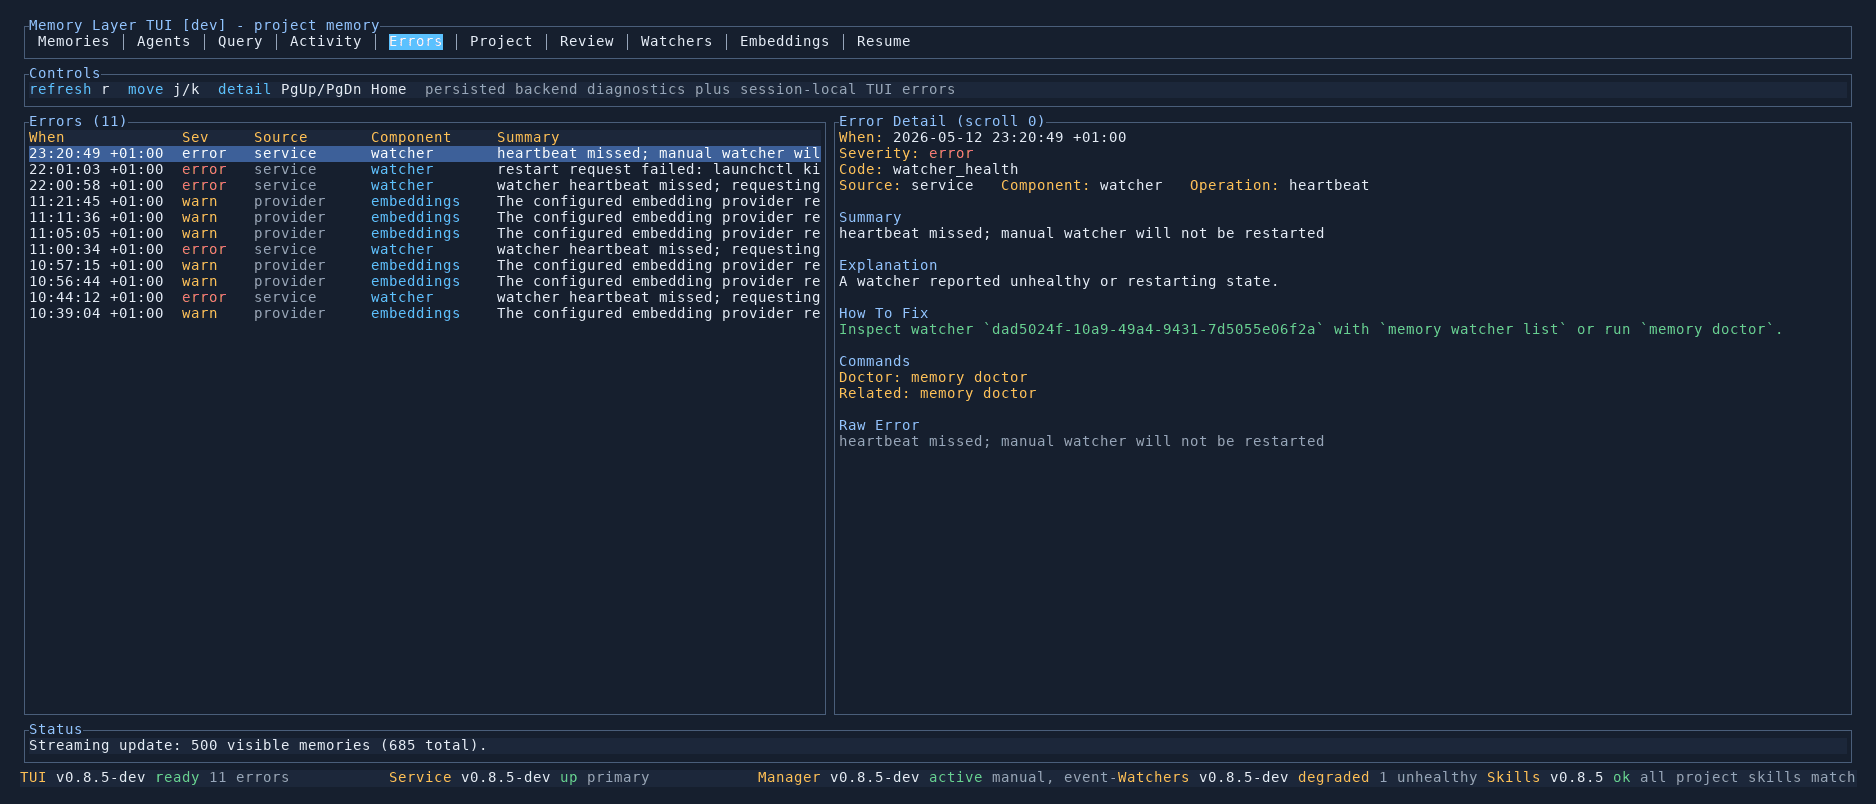
The Errors tab collects persisted backend diagnostics and session-local TUI errors into a single view. Each error includes an explanation and specific CLI commands to fix it.
Error list
The left panel shows all errors and warnings as a table:
- When — timestamp of the error
- Severity —
error(red) orwarn(yellow) - Source — which system produced the error (e.g.
service,provider) - Component — the specific component involved (e.g.
watcher,embeddings) - Summary — a short description of what went wrong
Error detail
Selecting an error shows its full diagnostic information in the right panel:
- Error code — a machine-readable identifier (e.g.
watcher_health) - Source, component, and operation — where in the system the error occurred
- Summary — what happened
- Explanation — a human-readable description of why this error matters
- How to fix — step-by-step remediation, including the specific watcher UUID or resource to inspect
- Commands — ready-to-copy CLI commands (e.g.
memory doctor,memory watcher list) - Raw error — the underlying error message for debugging
Common errors
| Error code | Meaning |
|---|---|
watcher_health | A watcher missed its heartbeat or entered a degraded state |
embedding_provider | An embedding provider returned an error or timed out |
Controls
| Key | Action |
|---|---|
j / k | Move between errors |
PgUp / PgDn | Scroll by page |
Home | Jump to top |
r | Refresh errors |