TUI
Watchers tab
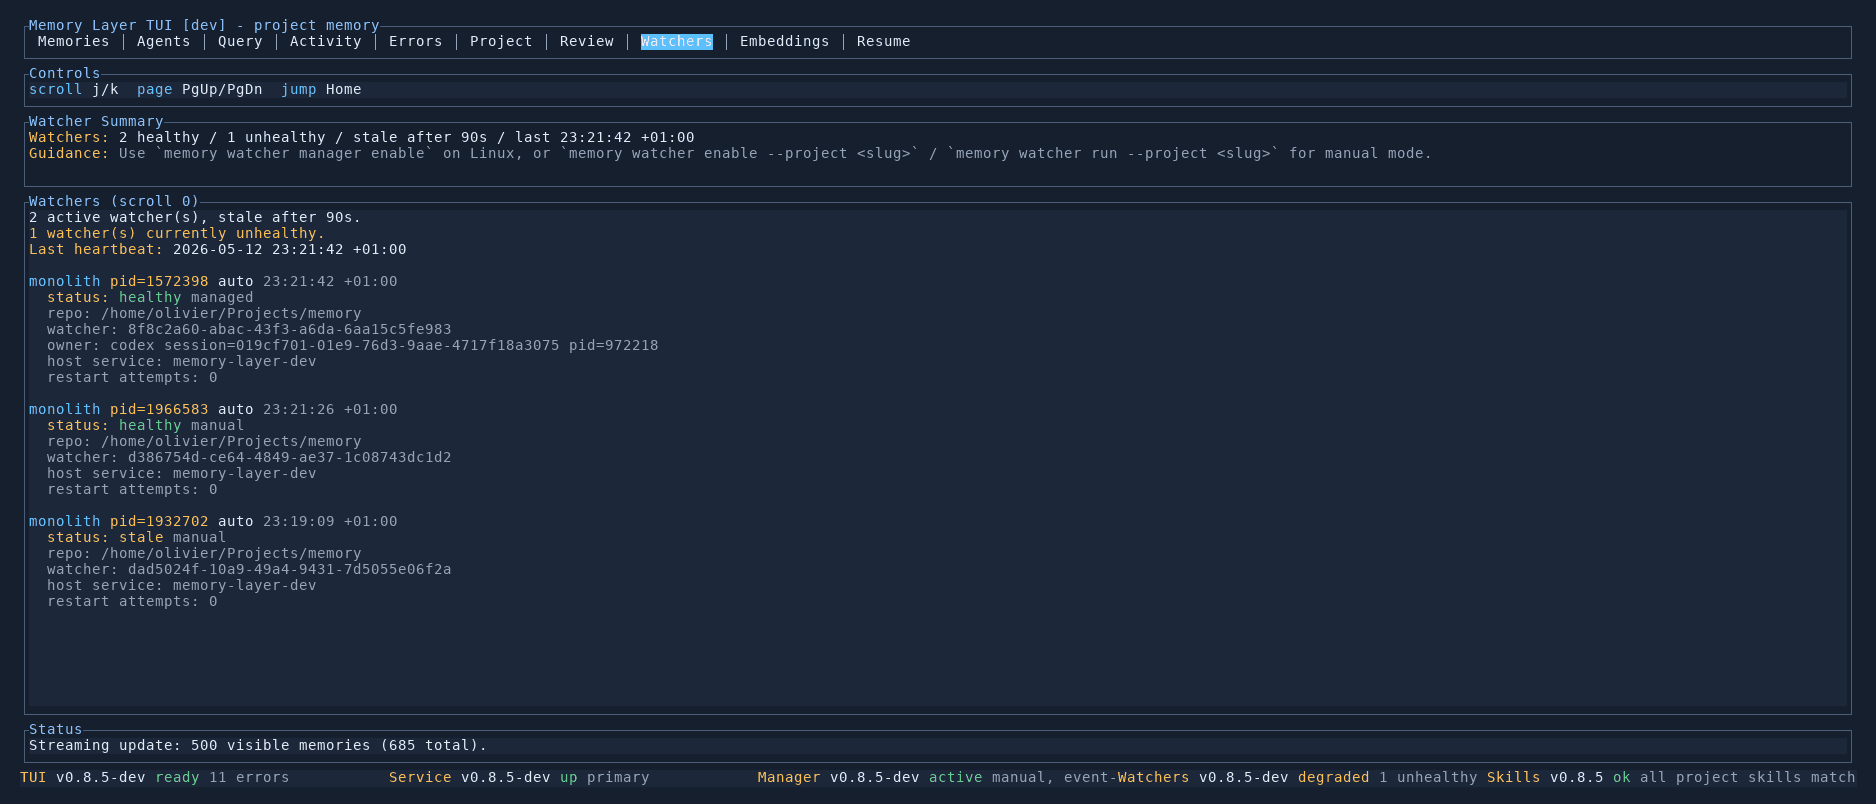
The Watchers tab shows all background watcher processes for the current project. Watchers observe agent sessions and capture activity events that feed the memory pipeline.
Watcher summary
The top section shows an overview:
- Healthy / unhealthy counts — how many watchers are running normally versus degraded
- Stale threshold — how long before a watcher is considered stale (default 90 seconds)
- Last heartbeat — timestamp of the most recent heartbeat from any watcher
- Guidance — CLI commands for enabling or managing watchers
Watcher list
Each watcher entry shows its full status:
- PID and mode — the process ID and whether it runs in
autoormanualmode - Timestamp — when the last heartbeat was received
- Health status —
healthy/managed,healthy/manual, orstale/manual - Repository path — which directory the watcher monitors
- Watcher UUID — unique identifier for this watcher instance
- Owner — for managed watchers, which agent session owns it (e.g. a Codex session with its PID)
- Host service — which Memory Layer service instance the watcher reports to
- Restart attempts — how many times the watcher has been restarted
Stale watchers are highlighted in a different colour so they stand out.
Controls
| Key | Action |
|---|---|
j / k | Scroll between watchers |
PgUp / PgDn | Scroll by page |
Home | Jump to top |